


Next: Conclusions
Up: Validation and Comparison Between
Previous: Comparison with manual measurements
Since the algorithm presented in this paper is able to segment both red-free
and fluorescein images, a second validation was undertaken to assess the
confidence of automatic measurements
in the most common clinical red-free images against the automatic measurements from the better
quality fluorescein images which are normally considered to be more accurate [7].
16 randomly taken individual bifurcations were automatically measured from red-free and
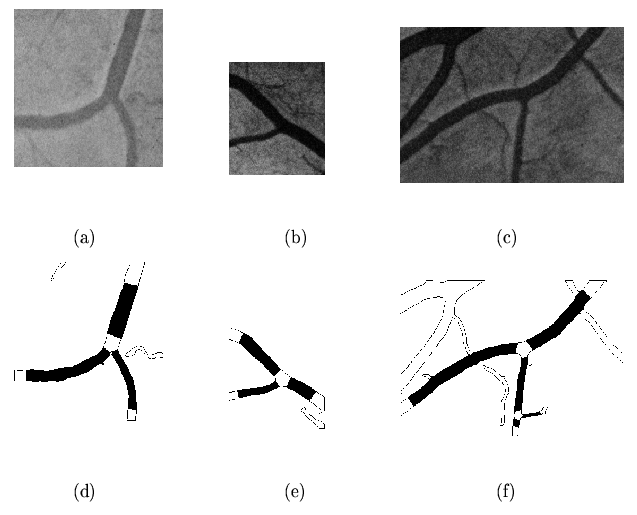
fluorescein paired images. Figure 13 shows the same bifurcations of
Figure 12 after the fluorescein dye injection.
Figure 13:
Some examples of individual bifurcations in gray scale fluorescein
images. (a - c) are the original subimages and
(d - f) are the segmented and measured segments.
Subimages are taken from gray scale images of size
 pixels.
 |
For this comparison,  corresponds to red-free measurements and
  corresponds to fluorescein. Table II summarises the results.
It can be seen that automatic measurements of both features in
fluorescein and red-free images are not significantly different.
This suggests that automatic measurements taken from the more clinically
common red-free images are comparable to those from fluorescein angiographs.
This result is contrary to previous manual measurements [26]
where significant differences
in diameters between red-free and fluorescein were found, this result is also
shown in Table II. In this case the manual normalised
differences of diameters from fluorescein images are larger than in red-free.
Figure 14 shows the normalised differences  plotted against the average
for both automatic (a) and manual (b).
The means are shown as solid lines,
plotted against the average
for both automatic (a) and manual (b).
The means are shown as solid lines,  two standard deviations as dashed lines.
Figure 14:
Fluorescein against red-free comparisons.
Normalised differences plotted against the average
for both automatic (a) and manual (b). The means are shown as
solid lines, two standard deviations as dashed lines.
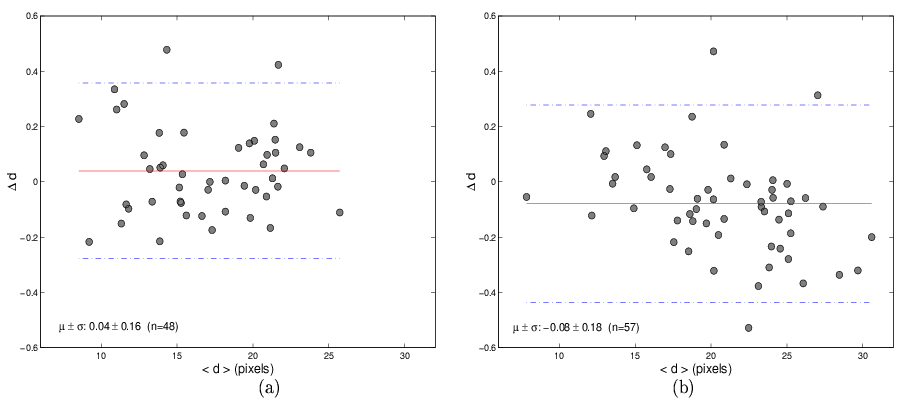 |
It can be seen from Figure 14(b) that there is a certain tendency for
fluorescein manual measurements of diameters to be generally smaller than red-free for small
vessel widths, whereas they are larger for larger vessel widths.
This bias with vessel size is not observed in the automatic measurements (Figure 14(a))
and it may explain the differences of significance for the p values for manual measurements.
Next: Conclusions
Up: Validation and Comparison Between
Previous: Comparison with manual measurements
Elena Martínez
2003-05-16
![\framebox[15cm][c]{
\parbox[c]{14cm}{\small Fluorescein against red-free compari...
...pm 0.09$\ & $19$\ & $0.44$\\ \hline
\par
\end{tabular} \\ [0.5ex]
\end{center}}}](img98.png)