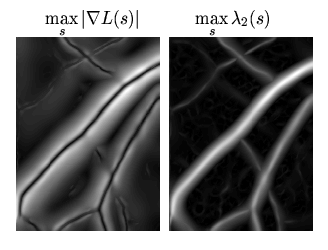
We calculate the features for all integer values of ![]() ,
,
![]() ,
where
,
where ![]() and
and ![]() are fixed according to the sizes of
the smallest and largest vessels radius to be detected in the image.
are fixed according to the sizes of
the smallest and largest vessels radius to be detected in the image.
Although this multiscale approach ensures that all spatial points and all scales are treated equally and consistently, it does not address the problem of how to select the appropriate scales for further analysis. A general methodology for feature detection with automatic scale selection has been proposed by Lindeberg [20,21]. The basic idea of this approach is to apply the feature detector at all scales, and then select levels from the scales at which normalised measures of feature strength assume local maxima with respect to the scale. However, some other ad hoc methodologies, particularly developed to enhance tube-like structures, have suggested the maximisation of feature strength over the scale, either maximising normalised measures of filter response [16] or by applying an equalisation of noise level to the normalised derivatives [18].
Our approach is similar in
that it is based on extracting the information across the
scales by finding the local maxima over scales (pixel by pixel) for both
measurements of feature strength, applying an equalisation factor based on the width
of the vessel we are looking for at certain scale.
If we compute the local maximum along the scales for
![]() and
and
![]() from the subimages shown in
Figure 3 and Figure 5,
as defined before, we find that the local maximum
response is much higher for large blood vessels than for small
ones (Figure 6).
from the subimages shown in
Figure 3 and Figure 5,
as defined before, we find that the local maximum
response is much higher for large blood vessels than for small
ones (Figure 6).
 |
This might be expected since the vessels are approximately cylindrical so that the total amount of blood in the light path corresponding to each pixel is larger in large vessels. Thus, there will be more absorption of non-red light in the red-free images and increased fluorescence in fluorescein images in the larger vessels, and therefore high principal curvatures. In fact this is one qualitative feature that ophthalmologists normally use to differentiate veins from arteries, veins are generally wider and brighter/darker than arteries. In the case of the gradient magnitude, it is shifted as the blurring increases with increasing scale (refer to Figure 6).
To account for this effect, we introduce a
diameter-dependent equalisation factor at each scale. Because vessels with diameter
![]() are most strongly detected when the scale factor is
are most strongly detected when the scale factor is ![]() . We normalised
each feature along scales by
. We normalised
each feature along scales by ![]() and then kept the local maxima over scales:
and then kept the local maxima over scales:
 |
We stress that in our algorithm the scale at which we find
the maximum for ![]() is not used to define the width of the
vessel but rather as an approximation that will be refined during the
region growing phase of the algorithm.
is not used to define the width of the
vessel but rather as an approximation that will be refined during the
region growing phase of the algorithm.
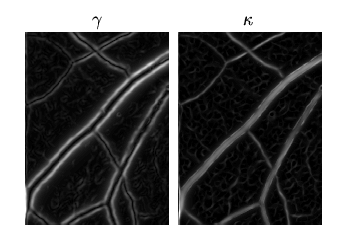
These values, the local maxima of the feature equalised gradient
magnitude, ![]() , and the local maxima of the feature equalised
maximum principal curvature,
, and the local maxima of the feature equalised
maximum principal curvature, ![]() , are the two
features used to classify pixels in the image into two region classes,
background and vessel, using a multiple pass region
growing procedure.
, are the two
features used to classify pixels in the image into two region classes,
background and vessel, using a multiple pass region
growing procedure.